What did we do?
In the autumn and winter of 2023, FOWG ran a public survey exercise to establish current feeling towards the project, and to gather information about how often they might use the Greenway and which sections for what reasons, and what challenges or problems should be considered by those planning the Greenway. We intend this to inform those planning the Greenway. A sample size of 1,705 was achieved through an online questionnaire (4 times the responses we were initially hoping for) over a ten-week period. Respondents were overwhelmingly in favour of the greenway with 95% in support of the proposal. We intend to share this feedback to inform those planning the Greenway.
Of those who indicated support or strong support, their main comments were that a safe active travel route is desperately needed in the valley, and how commuters, families and the community would benefit.
Of those who were undecided about the project, their key issues were how it would respect the environment, keep a good level of maintenance, ensure user safety, and provide good links with other routes.
Those who were against or strongly against were largely concerned with the mix of uses and speeds, a perception of wasted or mismanaged money, habitat protection, or being close to their personal land holdings.
The below charts presents a high level view of the survey results and aims to draw useful conclusions from them.
You can also read through our report offering detailed breakdown of the results.
Your Feedback
What the Results Tell Us
Q. Do you support the idea of a Wharfedale Greenway?

Over a 10 week period from October 2023, we received 1705 responses to our online consultation survey. It was promoted via social media, local media outlets, posters and those on our mailing list.
An overall 95% either strongly supported or supported the idea of the greenway with 1.7% of responses either strongly against or against the idea of the greenway. 2.8% of responses were either not sure or other.
This question was intended to gauge attitude towards the project as a whole. All respondents were given the opportunity to write in any positives or concerns that they might hold regarding the greenway (see reservations expressed graph), and these responses have been studied and addressed in our detailed report. We are keen that no concern should be dismissed out of hand just because general support for a Wharfedale Greenway remains high.
Q. Would you use the Greenway and for what reason?

Walking and cycling are the most popular uses that respondents thought they would use the greenway for, followed by running and family cycling. About 18% indicated they would use it as an alternative to the road for utility journeys or commutes. Even though this would see the Greenway largely taking on a recreational purpose, any reduction in casual/family cyclists and walkers needing to use A roads is to be welcomed, for reasons of safety and the alleviation of congestion by promoting an active travel culture.
Access to train stations offering links to Ilkley, Burley in Wharfedale and Menston stations as well as bus stations in Otley and Ilkley are a real benefit for commuting around and beyond the Wharfe Valley using public transport instead of a car. As well as access to local schools, shops and businesses to keep car journeys at a minimum and promotes a healthier lifestyle.
Q. Reason for your support?

The question used to gather this data (“What are your main reasons for supporting the greenway?”) allowed respondents to choose their level of agreement, disagreement or neutrality with each of the options provided. The graph above shows the number of people who selected agree or strongly agree for each item. The greatest reasons for support were a traffic-free walking route and the increased opportunity fitness & recreation, with 93% and 91% of respondents respectively indicating support for this, while creating an equestrian route was the least popular, with only 41%.
Feedback indicated that car free routes would be a major benefit to the greenway, avoiding the busy A65 as much as possible.
Q. How often would you use the proposed greenway?

Pool in Wharfedale to Otley:
Pool-in-Wharfedale to Otley route seeing the fewest indicative future users yet 24% of people who responded to the Otley Pool section would use it daily or once or more a week.
Otley to Burley in Wharfedale:
49.8% of respondents said they would use this section daily or once or more a week.
Menston Link:
With 52.7% indicating daily use or once or more a week, the Menston link would be useful for Otley residents to get to the train station or St Mary’s School using active travel methods. Or perhaps Menston residents travelling to larger towns for shopping or employment/bus station.
Burley to Ilkley:
This section of route was indicated as the most used section of the route. 53.5% of responses stated they would use this route daily or once or more a week. Again with schools, businesses and a car free alternative to the A65 proving popular feedback.
Ilkley to Addingham:
41% responded saying they would use the Ilkley to Addingham route on a daily or once or more a week. With the busy A65 road this could be an alternative for schools, bus and train stations in Ilkley as well as increasing commerce to both towns.
Addingham to Bolton Bridge:
27.8% of respondents said they would use this section daily or once or more a week yet 70% said they would use it occasionally or once or more a month. This could be a mixture of a route into the dales for recreation which could also increase commerce benefits to the Bolton Abbey area and beyond.
Q. How do you think you would use the proposed Greenway?

This page is specifically looking at those who would use the Greenway for Commuting/utility journeys.
This shows the usage of when people might use the greenway to visit shops/businesses or if they work locally or go to school, would use the greenway instead of perhaps getting in the car.
75 people (32.8%) responded saying they would use the greenway from Pool in Wharfedale to Otley for commuting/utility purposes either daily or once or more a week.
129 people (49.8%) responded saying they would use the greenway from Otley to Burley in Wharfedale for commuting/utility purposes either daily or once or more a week.
124 people (52.7%) responded saying they would use the Menston link for commuting/utility purposes either daily or once or more a week.
143 people (53.5%) responded saying they would use the greenway from Burley in Wharfedale to Ilkley for commuting/utility purposes either daily or once or more a week.
108 people (41%) responded saying they would use the greenway from Ilkley to Addingham for commuting/utility purposes either daily or once or more a week.
68 people (27.8%) responded saying they would use the greenway from Addingham to Bolton Bridge for commuting/utility purposes either daily or once or more a week.
Demographics of respondents
This data shows the demographics of those who responded to the consultation.

Ilkley residents responded the most with 449 responses (26.3%) closely followed by Otley (356 responses 20.9%) and Burley in Wharfedale (258 responses (15.1%)
Addingham had 133 responses (7.8%)
Menston had 130 responses (7.6%)
Pool in Wharfedale had 75 responses (4.4%)
304 responses (17.8%) were between <5k to >5k from the Wharfe Valley as well as other locations.

38.5% of respondents (554 people) were in the 45-60 age group followed by 25.6% being in the 61-74 age group (368 people) and 22.7% being in the 35-44 age group (327 people).
7.8% (112 people) were in the 25-34 age group
4.6% (66 people) were in the 75+ age group
0.6% (9 people) were in the 16-24 age group
0.3% (4 people) were in the under 16 age group
265 responses did not indicate an age group.

54.7% of respondents identified as female.
43% of respondents identify as male.
0.4% as Non Binary and 1.9% preferred not to say.

30.5% of respondents are households of couples with 24.6% are a family with young children and 15.5% are families with teenagers.
11.3% are Families with adult children.
9.4% are single households.
8.7% of households stated they were retired.

94.1% of the respondents identify as white whilst 1.1% are of mixed ethnic background.
0.4% as Asian/Asian British.
0.1% as Black/Black British.
3.5% preferred not to say and 0.6% stated other.
This data shows comments of any reservations about the proposed Greenway.

We have gathered the reservations expressed by some respondents into twelve most common broad themes and are represented in the graph above.
Conflict between users of different type and speed had the highest frequency of appearance. The worry of a mix of cyclists, dog walkers, horse riders etc if of course a concern but one which every greenway must collaborate on. The hope would be it is designed with strategies in mind to minimise conflict.
Timescales was also a large indicator in questioning why it was taking so long to action and when work would begin. Of course these things do take time. With the greenway proposal crossing multiple district lines, planning, design, some land ownership discussions all take time to resolve. We like to think that the current momentum is a big step in having the end in sight to the planning and construction may just be a few years away.
Biodiversity and nature is another big concern. Will trees be cut down? What will happen to wildlife? Until any detailed designs are commissioned, we don’t know the exact route or what impact it will have. However, we would push for a net 10% increase in biodiversity along the route. There are also studies into how greenways can protect and enhance wildlife and nature. Read how Sustrans, custodians of the national highways, created their “Greener Greenways Project“.
Maintenance and litter would all be addressed once build. Responsibilities would be identified to groups or local stakeholders to potentially support with.
Path width and type of surface depends on the final designs. Some surfaces are preferred by cyclists, runners and mobility users, some for equestrian users. Also to take into consideration water drainage and maintenance etc. Looking at other greenways for what may work best will be reflected in the final decision.
Lighting the greenway whilst providing a better feeling of safety for users in the darker winter months can also be a hinderance for wildlife. Again this would have to form any part of the final designs but we would hope a compromise between the two could be found.
Crime and antisocial behaviour is a concern that was highlighted on the survey. Proper design and maintenance, including some lighting, clear sightlines, and regular patrols, can help deter unwanted activity and ensure everyone feels safe using the greenway.
The Leeds Cycle Network Ambition
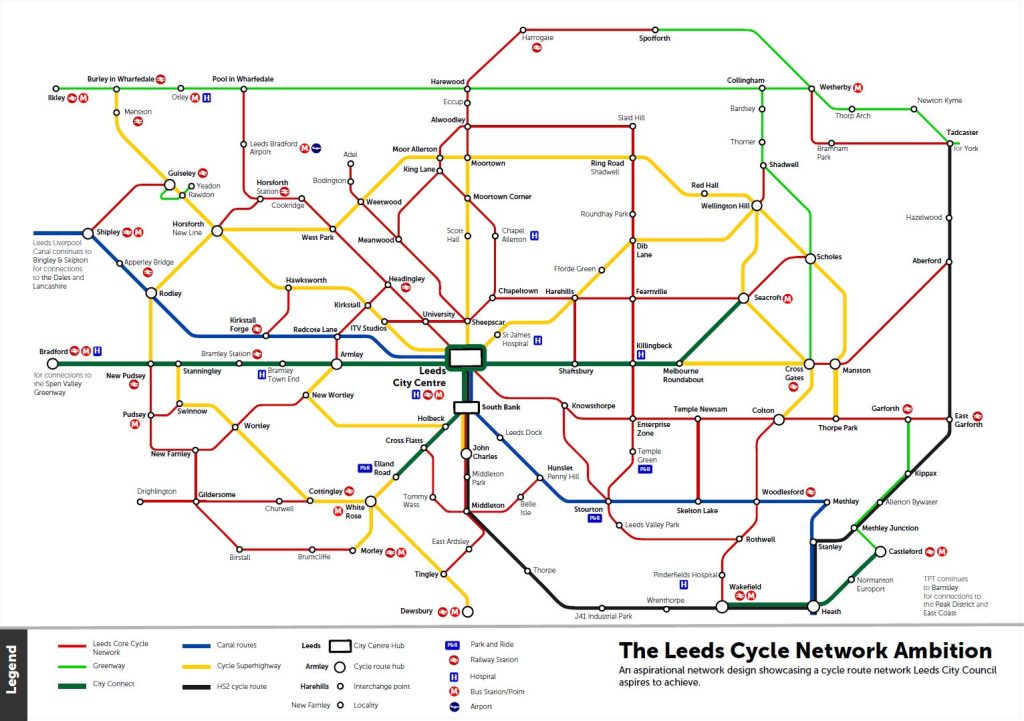
As you can see above, the Wharfedale Greenway does appear on the Leeds Cycle Network Ambition meaning that it does form part of their wider strategy to connect towns and villages in the wider Leeds area.
Support All Round

You can read our recent article in the Ilkley Gazette on how local representatives are keen to give us their support to the creation of the Wharfedale Greenway.